by Will
This is an aggregation of """expert""" opions to create an aggregate ranking and tier list of the RD2L PST-SUN teams. This uses average expert rank to generate a "consensus rank", and then a Gaussian Mixture Model, which is a type of unsupervised machine learning, to identify natural tier groupings.
Some of you who are familiar with fantasy football statistics will recognize this sort of content. I was heavily inspired by my favorite stat site by Boris Chen. This is not just a plug and play of his code, however, this was all done from scratch for this project.
Python analytic libraries are not my area of expertise, and I am not a data scientist, so this was a nice learning experience for me.
I used data from 5 different week 0 power rankings. These rankings were supposedly done by experts (more on that later). I picked rankings by Treebeard, Itachi, Clare, MGHappyHobo, and Box. The first thing I had to do was assemble the data into a usable format. This is where my first hurdle arose, and I actually gave up on this step for about a week because it was too aggravating.
Each team in my combined data set needed to have the same team name in each ranking list. For example, some people had 'seven thirty' listed as '7:30' or '730'. When collecting data I had to keep this in mind and normalize all the team names accross all my datasets. This was easier said than done, and in the end I wrote a python script to help me find mismatches. My script detected 59 teams initially, even after light cleaning during data transcription, which I had to normalize down to the expected 38 teams.
| Expert | Tier | Reason |
|---|---|---|
| Clare | S+ | Used same names as draft sheet, very easy to copy from google sheets |
| Itachi | S | Used same names as draft sheet, easy to copy from medium |
| BoX | S | Used same names as draft sheet, easy to copy from his site |
| MGHappyHobo | A | Names differed from sheets slightly, but always recognizable. Copying experience from google docs only average |
| Tree | F- | Only managed to get 3 names correct to the sheet, and only by accident. Ok copying experience, some team names were not formatted as expected. |
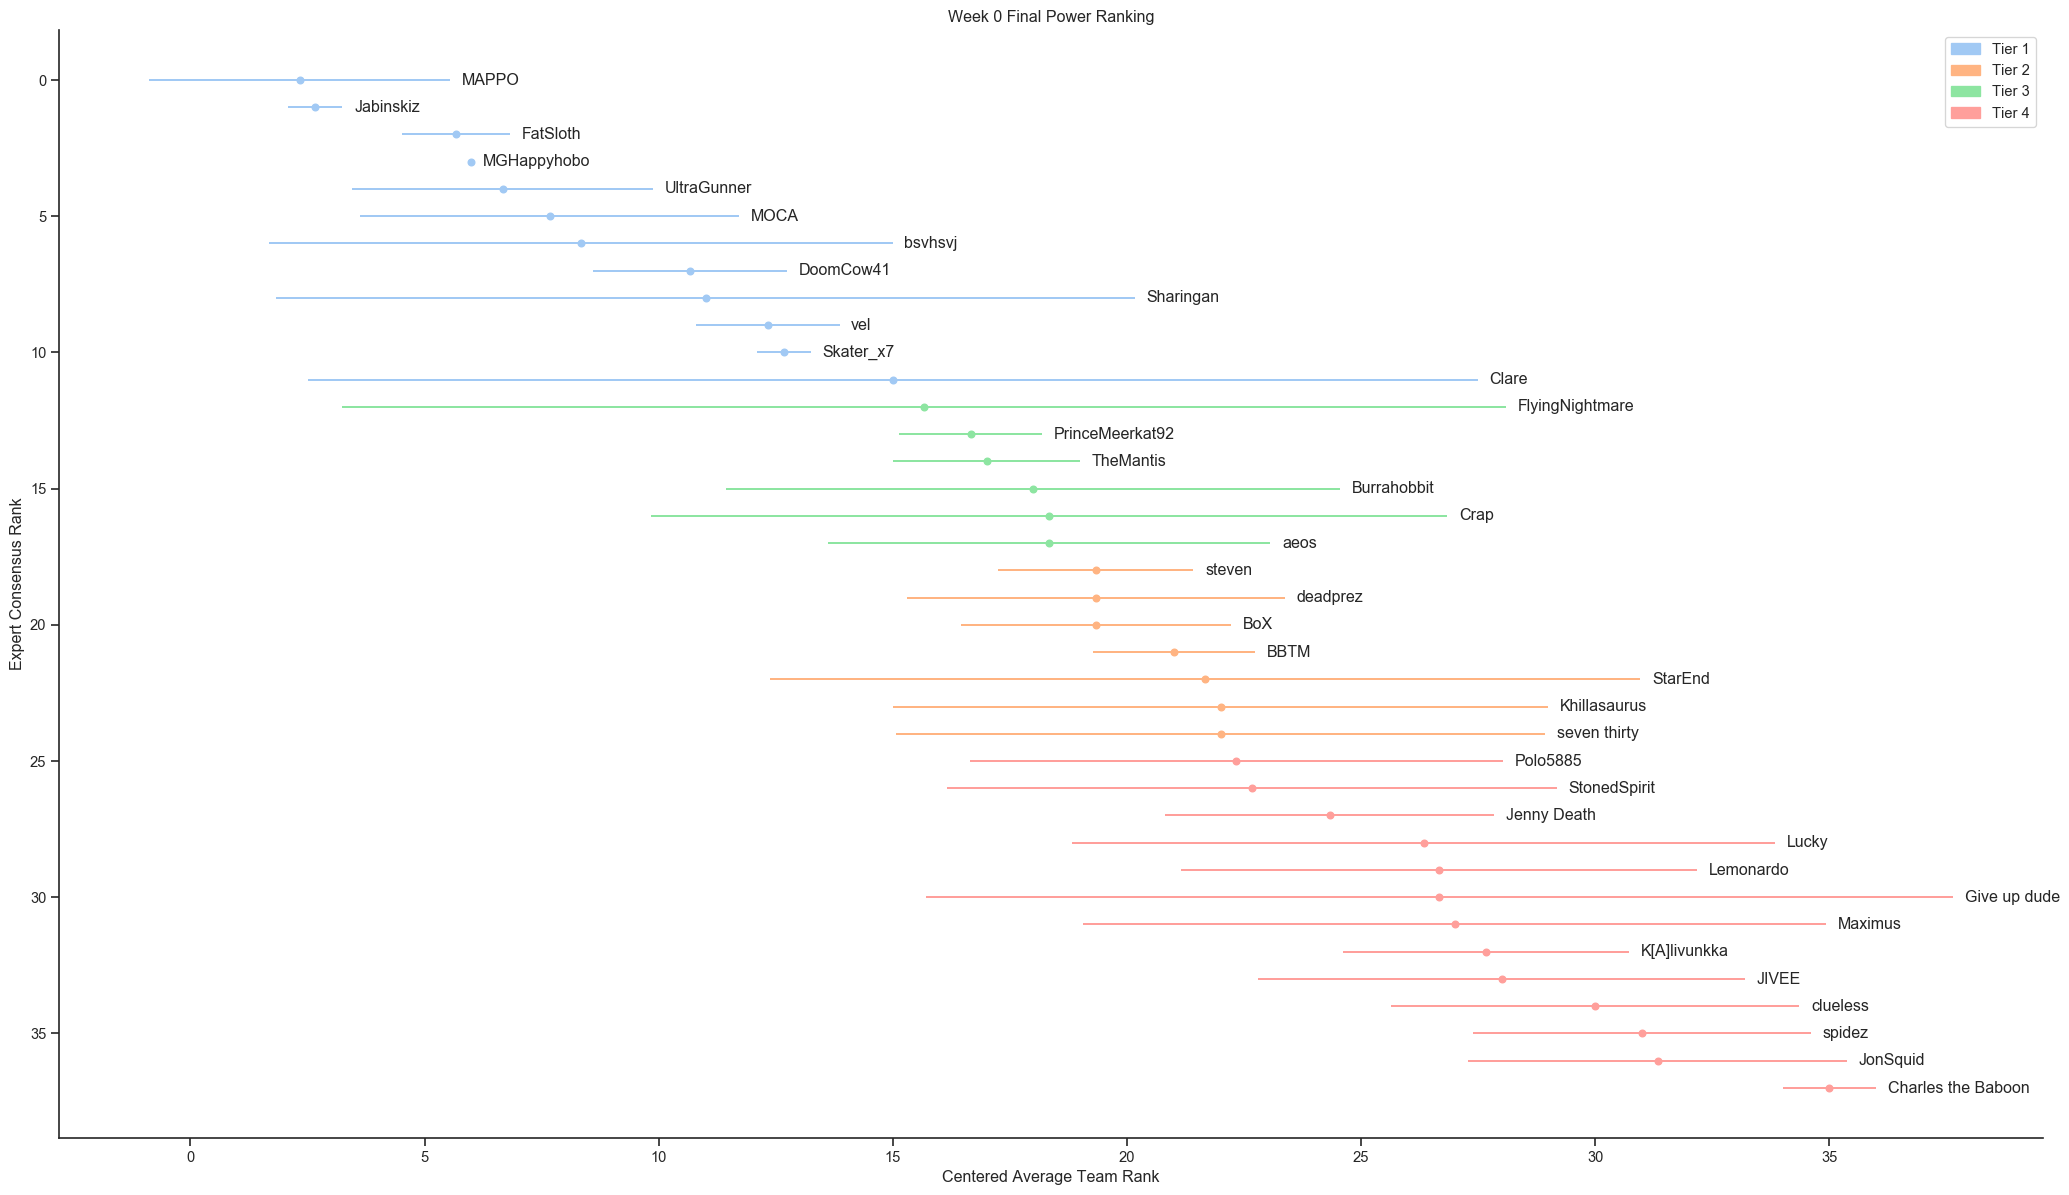
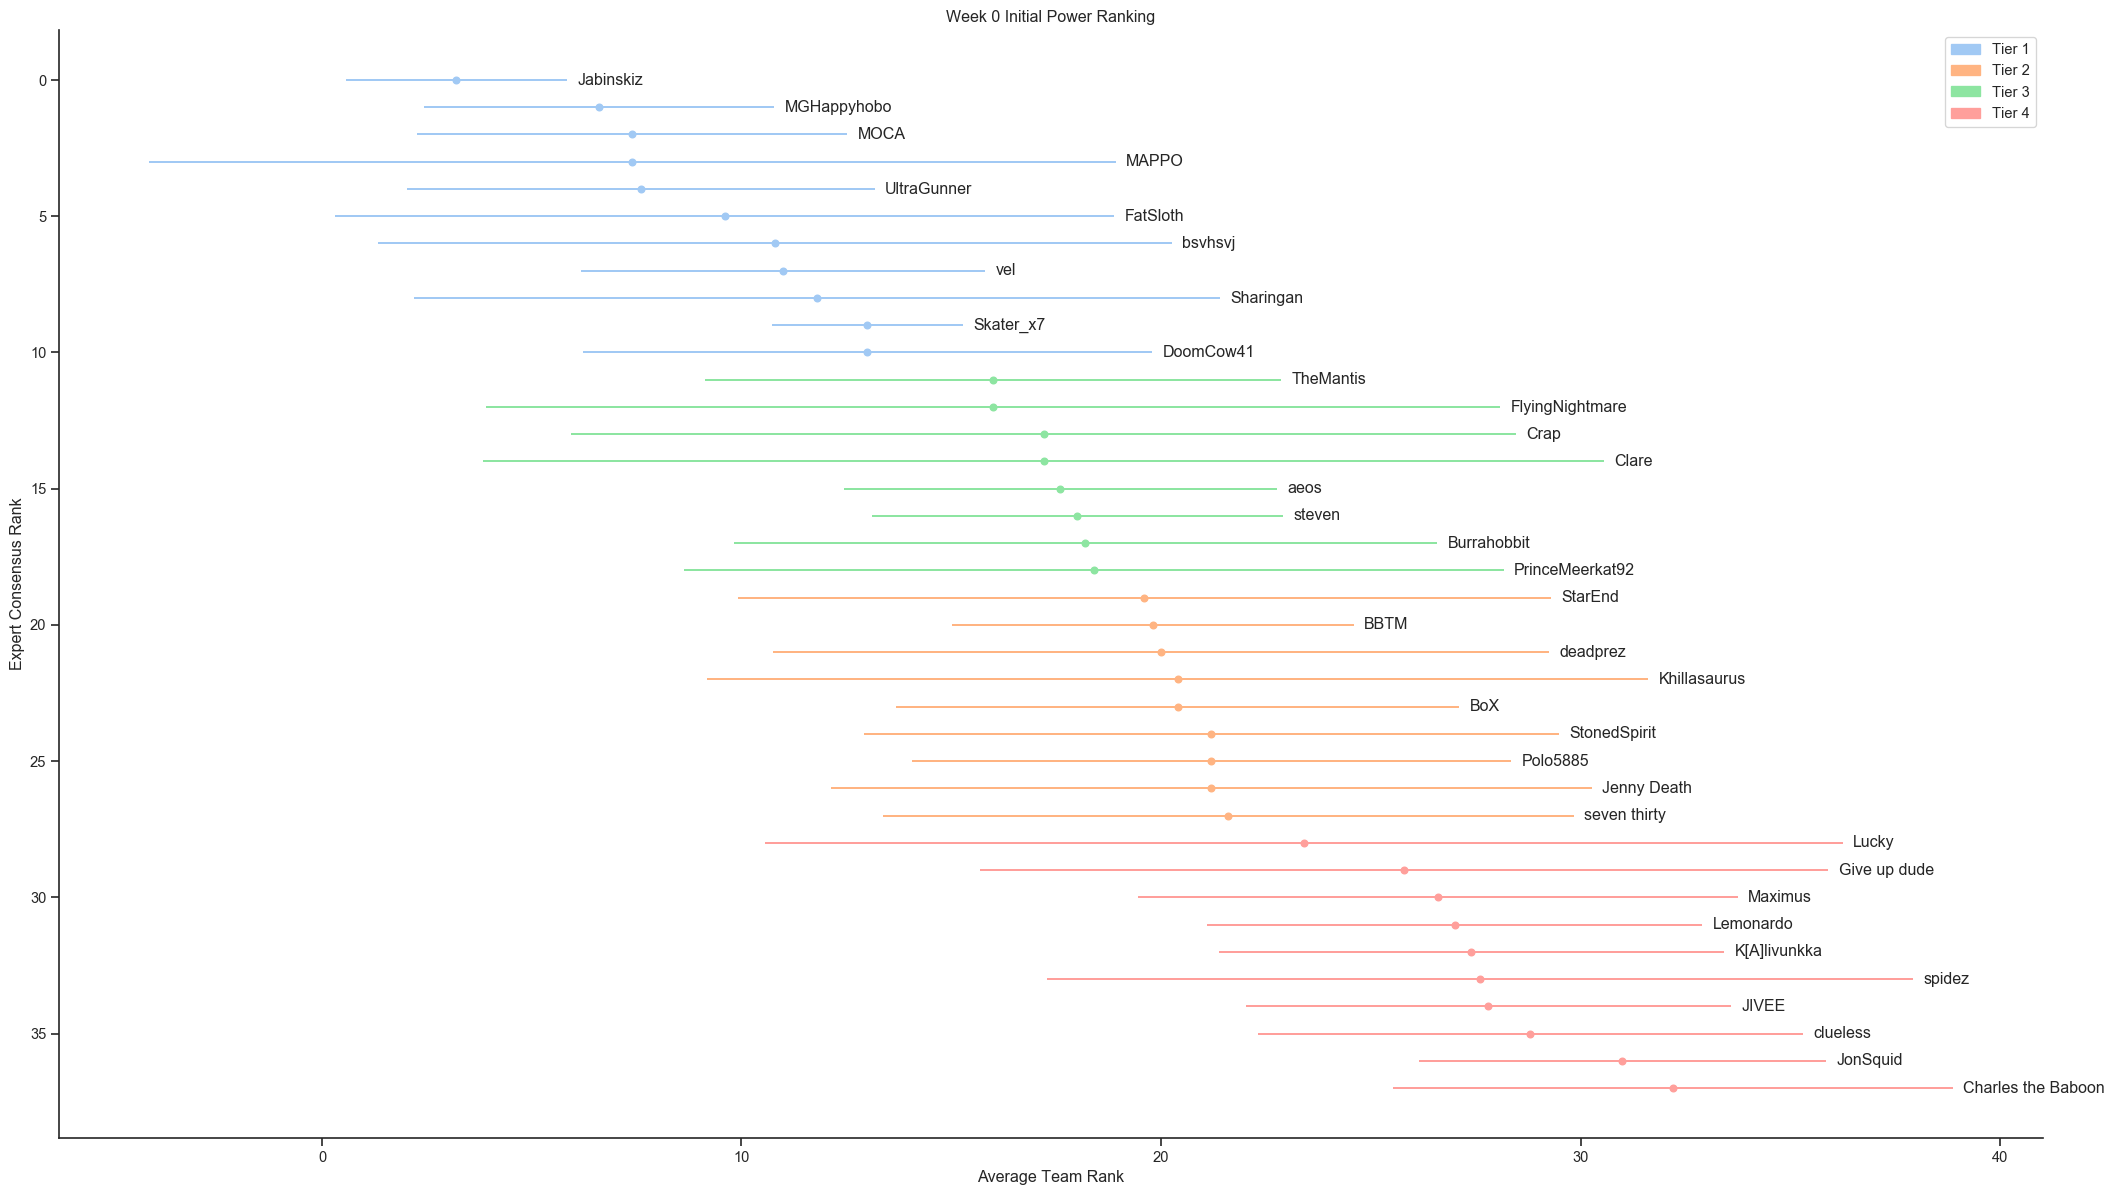
How to read: Teams in the top left are the best, while those in the lower right are the worst. The bars represent the standard deviation. Basically, the bigger the bar, the more uncertainty in the ranking.
This first graph is the final power ranking. As you may notice, I used a centered average for team rank (dropping min and max values from the average). This produced the best results, and will be explained in the conclusion.

            Tier 1: MAPPO, Jabinskiz, FatSloth, MGHappyhobo, UltraGunner, MOCA, bsvhsvj, DoomCow41, Sharingan, vel, Skater_x7, Clare

            Tier 2: steven, deadprez, BoX, BBTM, StarEnd, Khillasaurus, seven thirty

            Tier 3: FlyingNightmare, PrinceMeerkat92, TheMantis, Burrahobbit, Crap, aeos

            Tier 4: Polo5885, StonedSpirit, Jenny Death, Lucky, Lemonardo, Give up dude, Maximus, K[A]livunkka, JIVEE, clueless, spidez, JonSquid, Charles the Baboon
This second graph is the inital power ranking I did. I did not use a centered average here, and as a result, the deviation for most teams is too massive for this graph to be useful.

            Tier 1: Jabinskiz, MGHappyhobo, MOCA, MAPPO, UltraGunner, FatSloth, bsvhsvj, vel, Sharingan, Skater_x7, DoomCow41

            Tier 2: StarEnd, BBTM, deadprez, Khillasaurus, BoX, StonedSpirit, Polo5885, Jenny Death, seven thirty

            Tier 3: TheMantis, FlyingNightmare, Crap, Clare, aeos, steven, Burrahobbit, PrinceMeerkat92

            Tier 4: Lucky, Give up dude, Maximus, Lemonardo, K[A]livunkka, spidez, JIVEE, clueless, JonSquid, Charles the Baboon
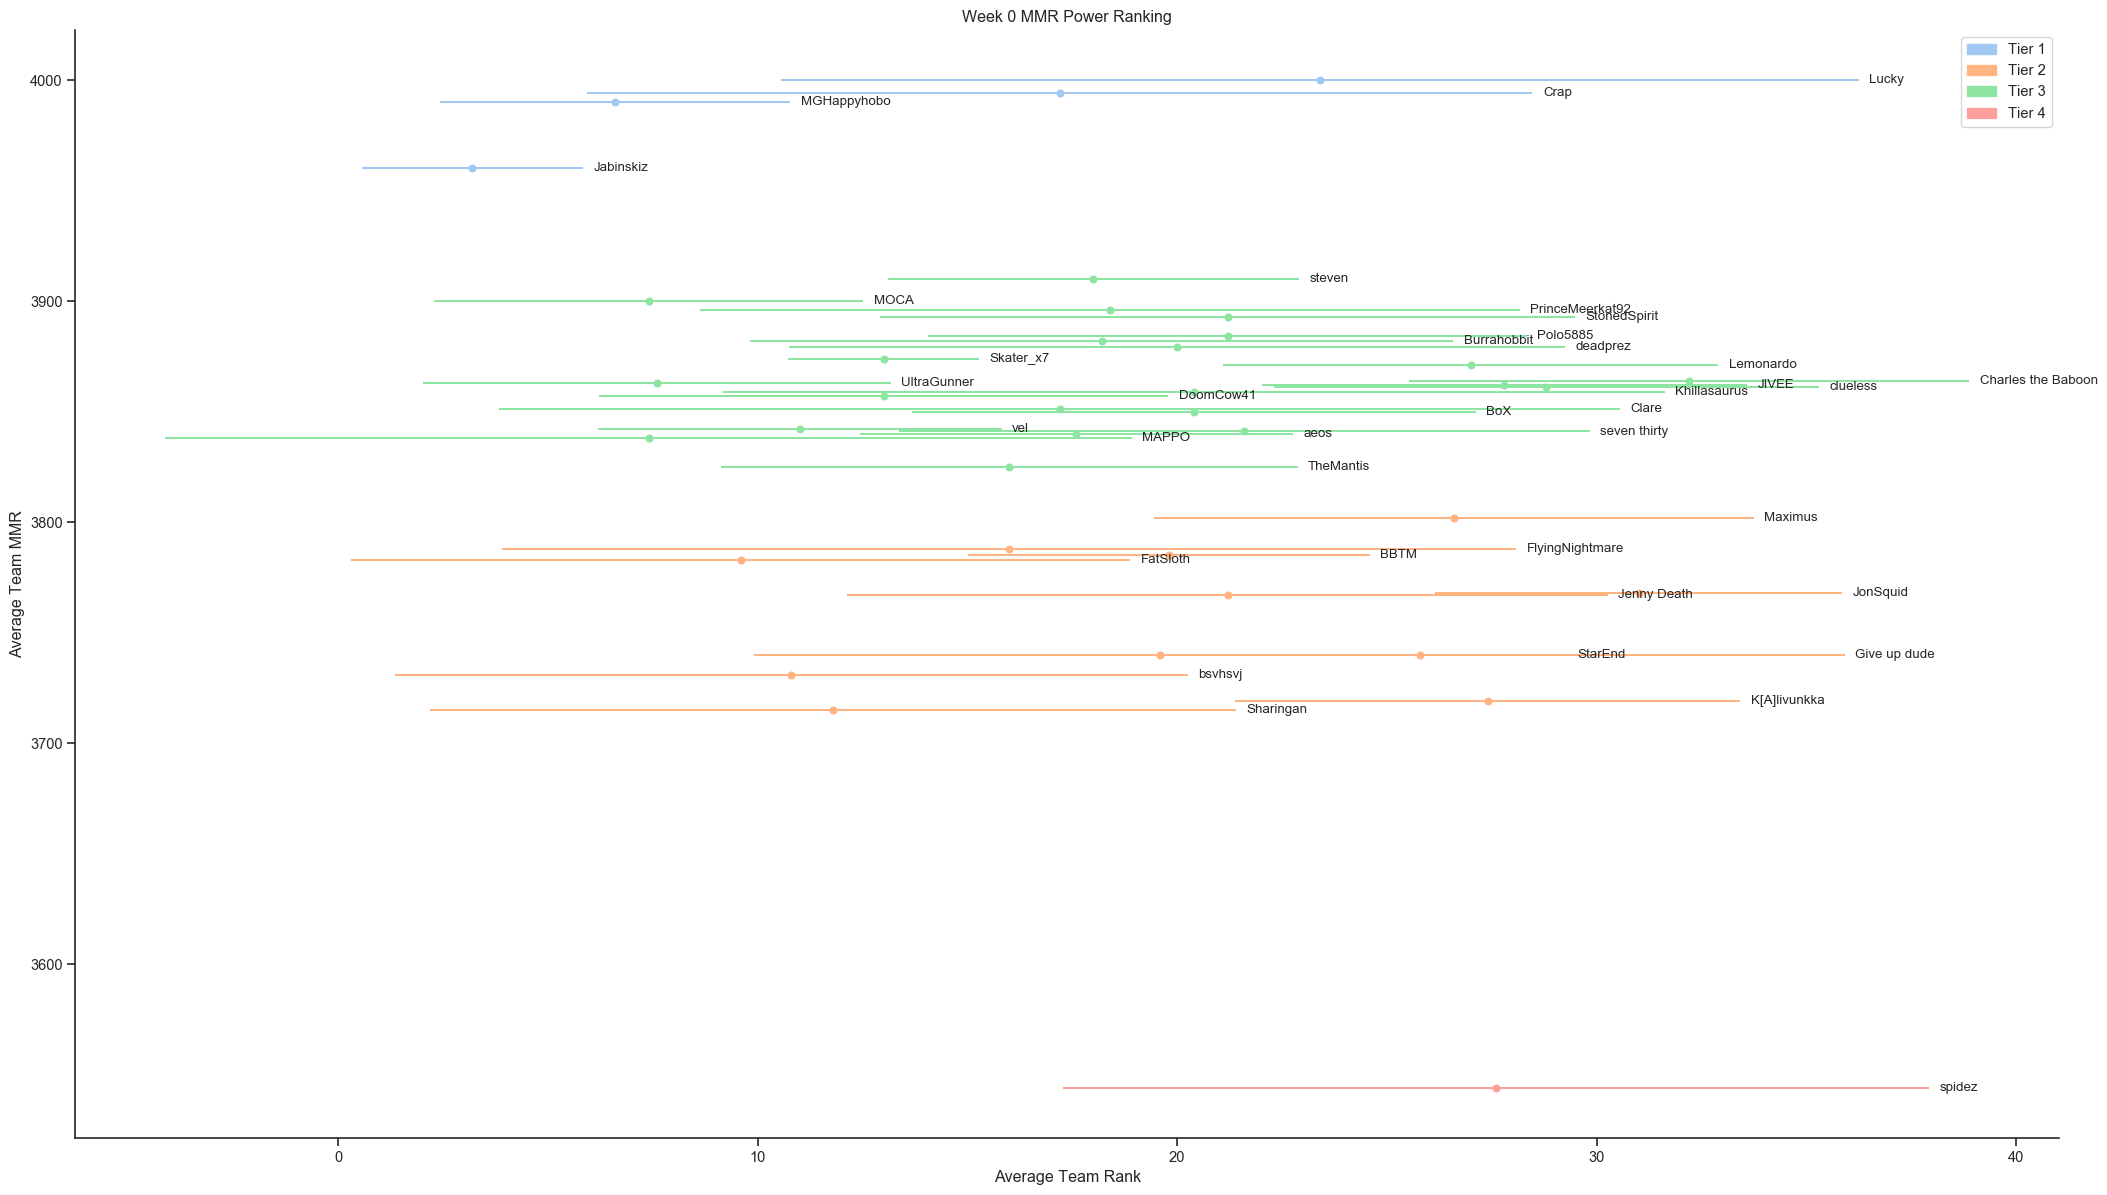
This final graph is an experimental one, plotting average team rank vs their MMR. This graph is mostly useless.

            Tier 1: Jabinskiz, MGHappyhobo, Crap, Lucky

            Tier 2: FatSloth, bsvhsvj, Sharingan, FlyingNightmare, StarEnd, BBTM, Jenny Death, Give up dude, Maximus, K[A]livunkka, JonSquid

            Tier 3: MOCA, MAPPO, UltraGunner, vel, Skater_x7, DoomCow41, TheMantis, Clare, aeos, steven, Burrahobbit, PrinceMeerkat92, deadprez, Khillasaurus, BoX, StonedSpirit, Polo5885, seven thirty, Lemonardo, JIVEE, clueless, Charles the Baboon

            Tier 4: spidez
These experts are questionable at best. There are a wild number of outliers in the data, almost as if nobody knows anything about predicting which team is best and they are throwing darts at a board. For example, a team might be rated ranks 1, 1, 2, and 7 by four experts, and 31st by the fifth (MAPPO's team). This leads to a massive ammount of variation in the data, and leads to the Week 0 Initial Power Ranking graph where all the ranks are wildly uncertain, and is not pleasing to look at or informative.
In order to get rid of the ourliers, while still maintaining some uncertainty if there was some within the expert rank, I chose a centered average for my the Week 0 Final Power Ranking graph.
The Week 0 MMR Power Ranking graph can be used as an MMR Tier graph. The average rank adds nothing here, and this graph would be better as simple a categorical graph based on MMR. Another thing it can tell us is that these rankings are largely arbitrary and not based on any existing rating system (MMR) and these power rankers are bad.
Itachi, Clare, Tree, BoX, MGHappyHobo for their power rankings
Greg, Cerys for listening to me complain about stuff they didn't care about