Thanks to BoX for inspiring me to look into this, I found it to be an interesting topic, and hopefully you do too.
Box is partially correct. In this application draft order 01101001 (Pattern A) was worse than draft order 01100110 (Pattern B). However, his findings indicated a 65%/35% advantage for Pattern B over Pattern A. This is incorrect and misleading due to the small number of trials conducted. The accurate numbers are a 55%/45% advantage to pattern B. In addition, as the number of picks increase, the accuracy of Pattern B decreases.
I ran his experiment with a 100,000 trials as opposed to 14 and here were the results:
| Pattern | Wins | Percentage |
|---|---|---|
| A (01101001) | 44855 | 44.99% |
| B (01100110) | 54821 | 54.82% |
| Ties | 179 | 0.19% |
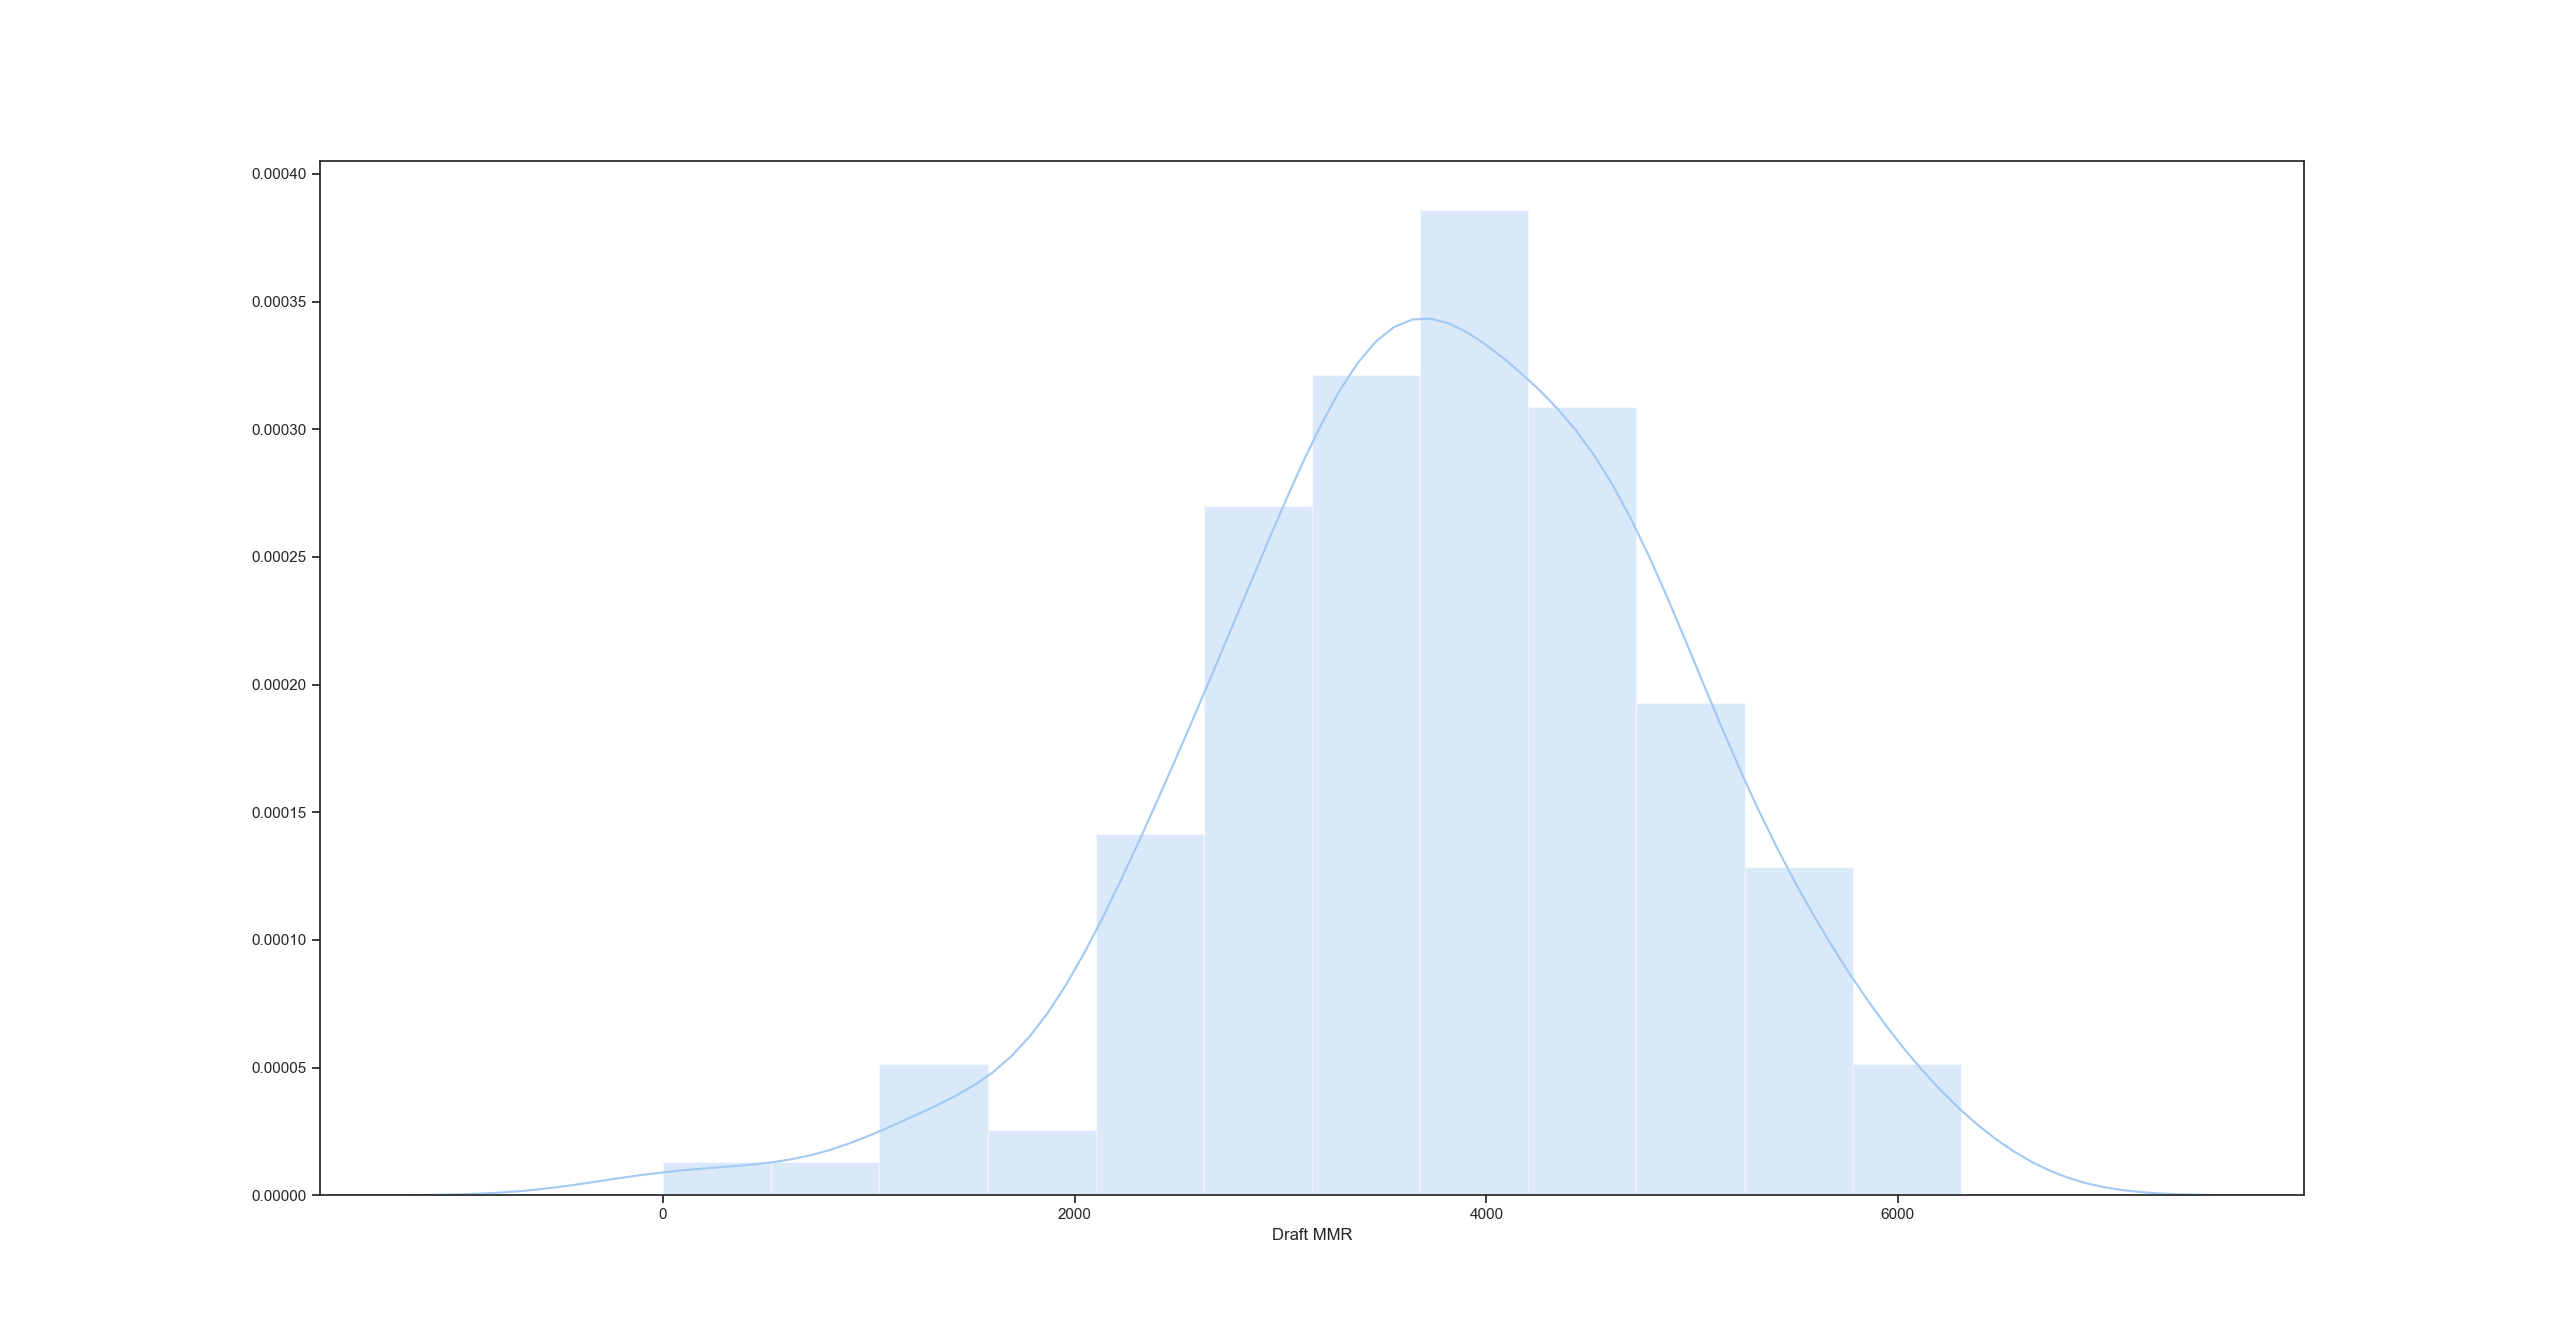
This particular observation is relevant to this dataset only. With a normal distribution of MMRs, both orders are equally as effective.
This can be roughly demonstrated as follows. Label picks 0, 1, 2, 3, 4, 5, 6, 7, in order of MMR, 0 being the highest and 7 being the lowest. With pick Pattern A, Team 1 gets picks 0, 3, 5, 6 and Team 2 gets picks 1, 2, 4, 7. Averaging these picks, both teams get average pick 3.5. (0 + 3 + 5 + 6)/4 = 3.5 and (1 + 2 + 4 + 7)/4 = 3.5. With pick pattern B, Team 1 gets picks 0, 3, 4, 7 and Team 2 gets picks 1, 2, 5, 6. Averaging these picks, both teams get average pick 3.5. (0 + 3 + 4 + 7)/4 = 3.5 and (1 + 2 + 5 + 6)/4 = 3.5. Also of note, the average of all the picks is (0 + 1 + 2 + 3 + 4 + 5 + 6 + 7)/8 = 3.5. As you can see, in both scenarios, both teams get the perfectly average pick. This is by no means mathematically rigorous, but demonstrates my point.
I also ran the experiment again, for those that want a more concrete example, but this time against a randomly generated normal distribution with the same number of datapoints as the above MMR set. Results:
| Pattern | Wins | Percentage |
|---|---|---|
| A (01101001) | 49949 | 49.95% |
| B (01100110) | 50051 | 50.05% |
| Ties | 0 | 0% |
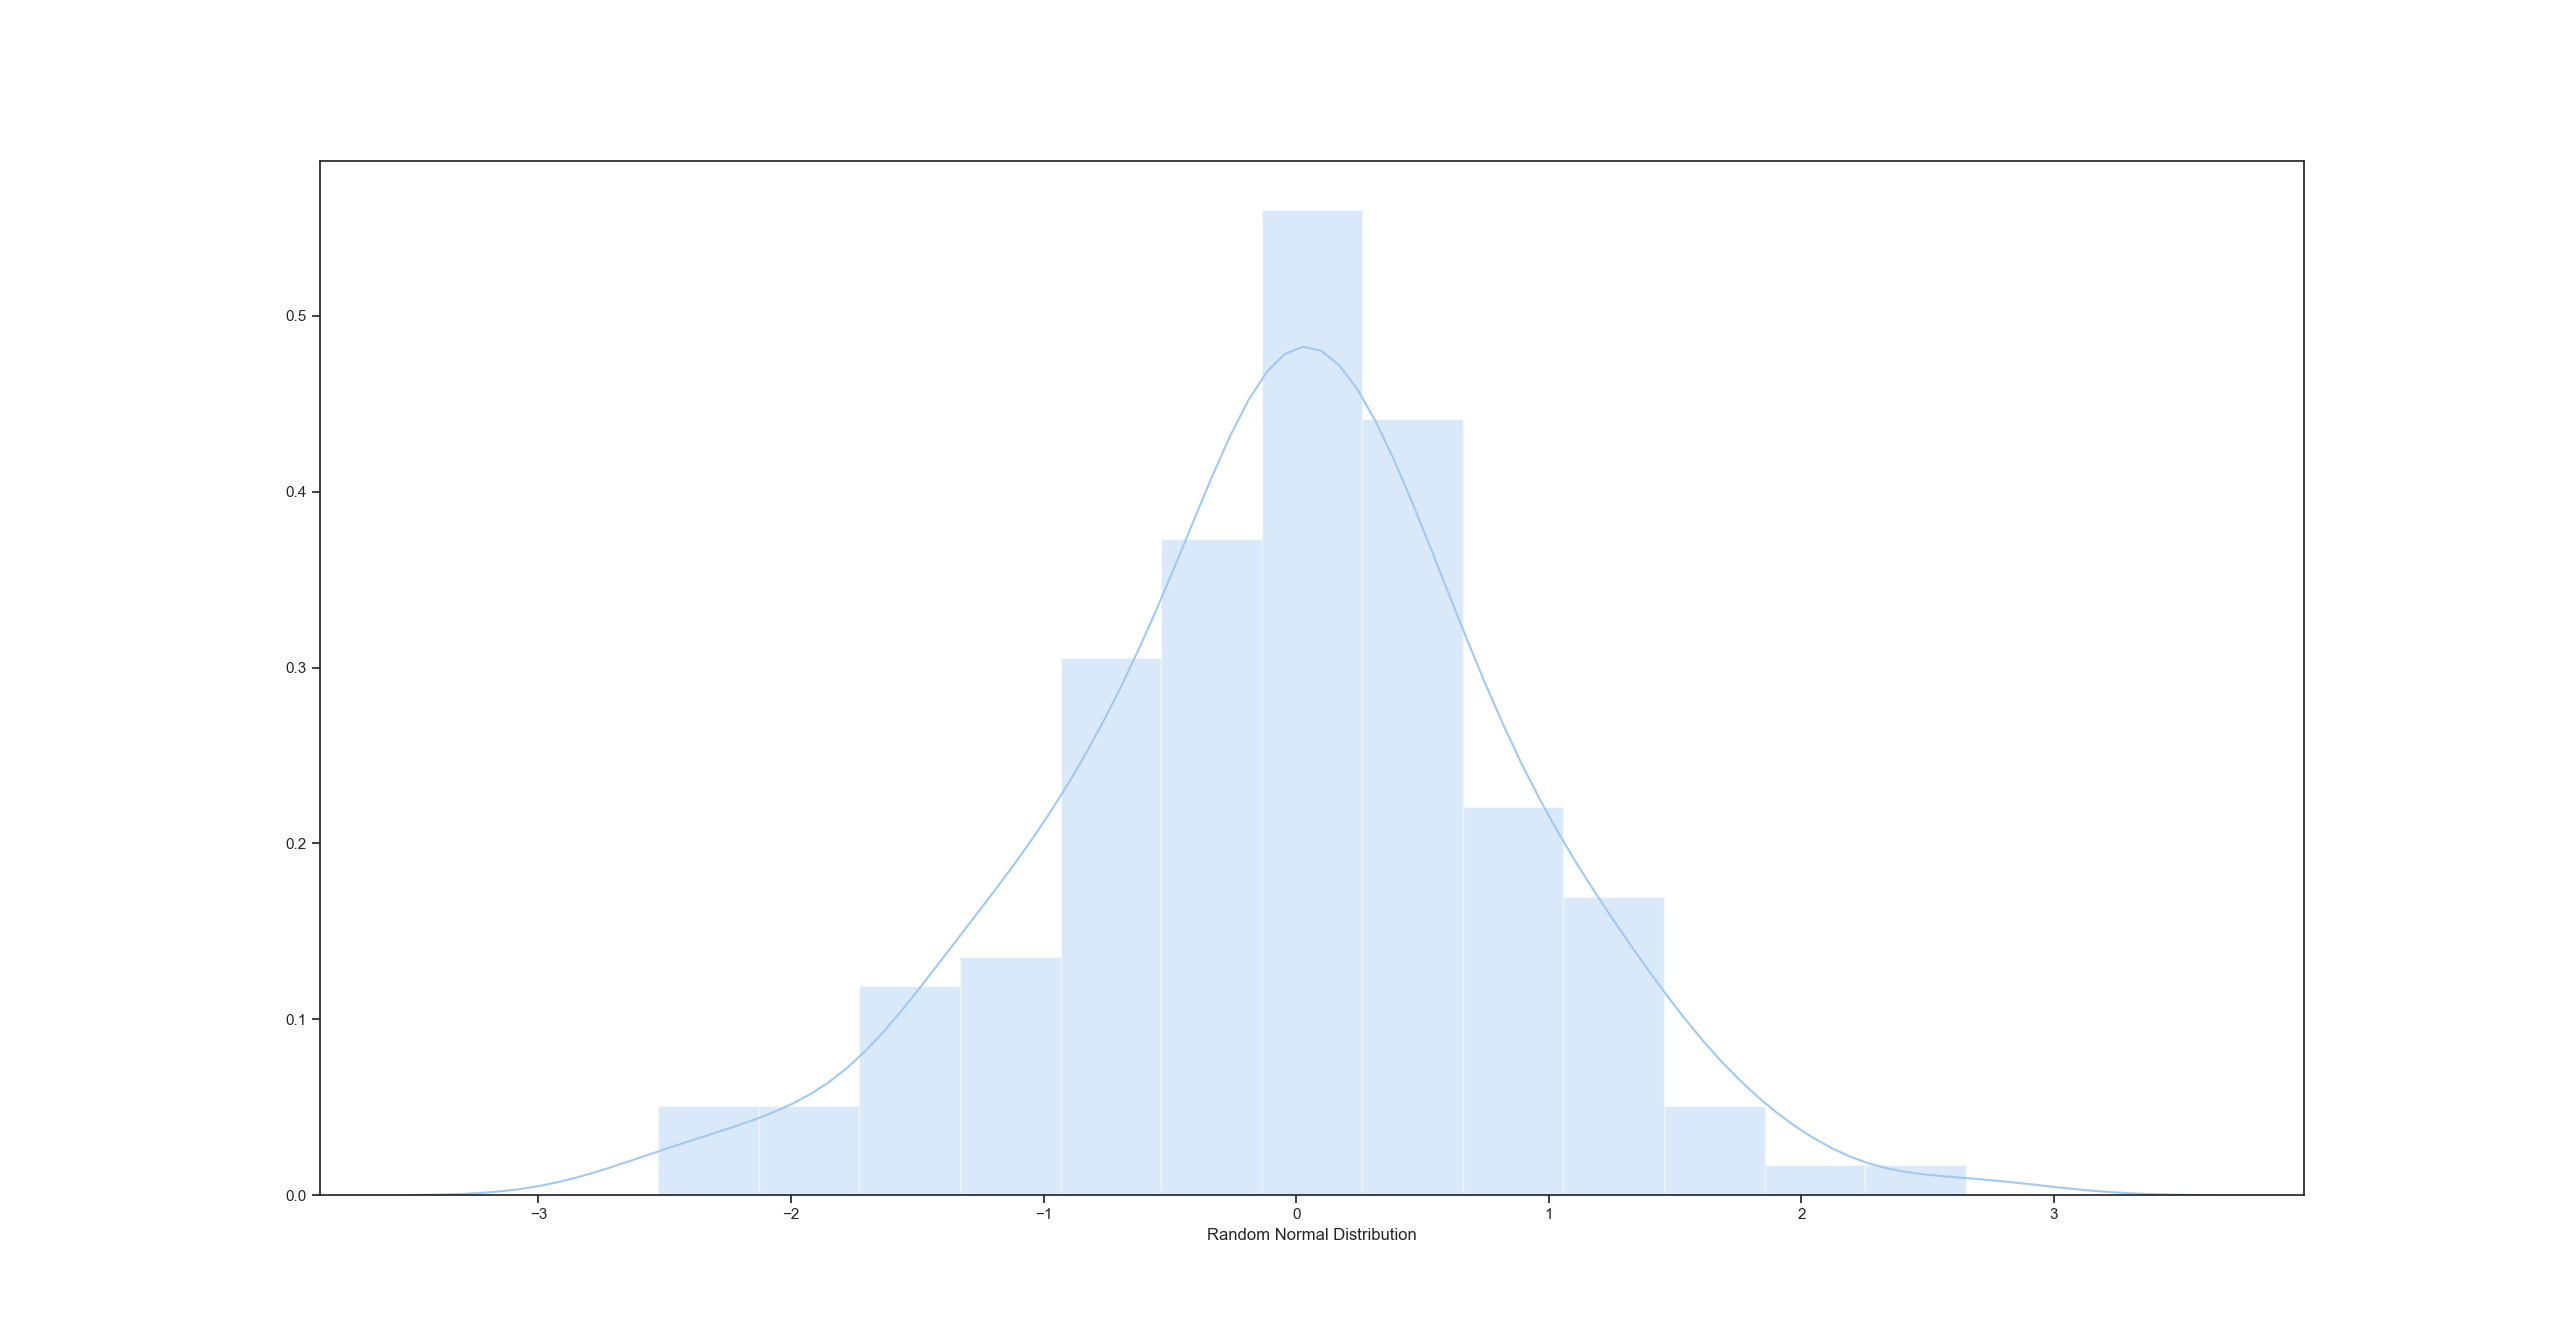
The more datapoints you use, the closer the distribution gets to normal, and the closer these results get to 50%/50%
Also of note is that Pattern A is the start of the Thue-Morse sequence (OEIS A010060). It continues, 0110100110010110.. and so forth. It can be generated by starting with 0, and appending the complement of the existing sequence to it. Ex: 0, 01, 0110, 01101001, ...
It can be proved that this sequence is the fairest way for two people to divide things up, when the two things are always either increasing, or decreasing (as our MMR example) both continuously and discretely. This example is explicitly touched on in the first reference in the form of pickup basketball captaining (2 captains selecting 4 players).
In this section, we assume each pick has a value of 1, but this can be expanded to either increasing or decreasing values. A constant value illustrates the point better here.
With Pattern B, Captain A is always expected to be advantaged or tied:
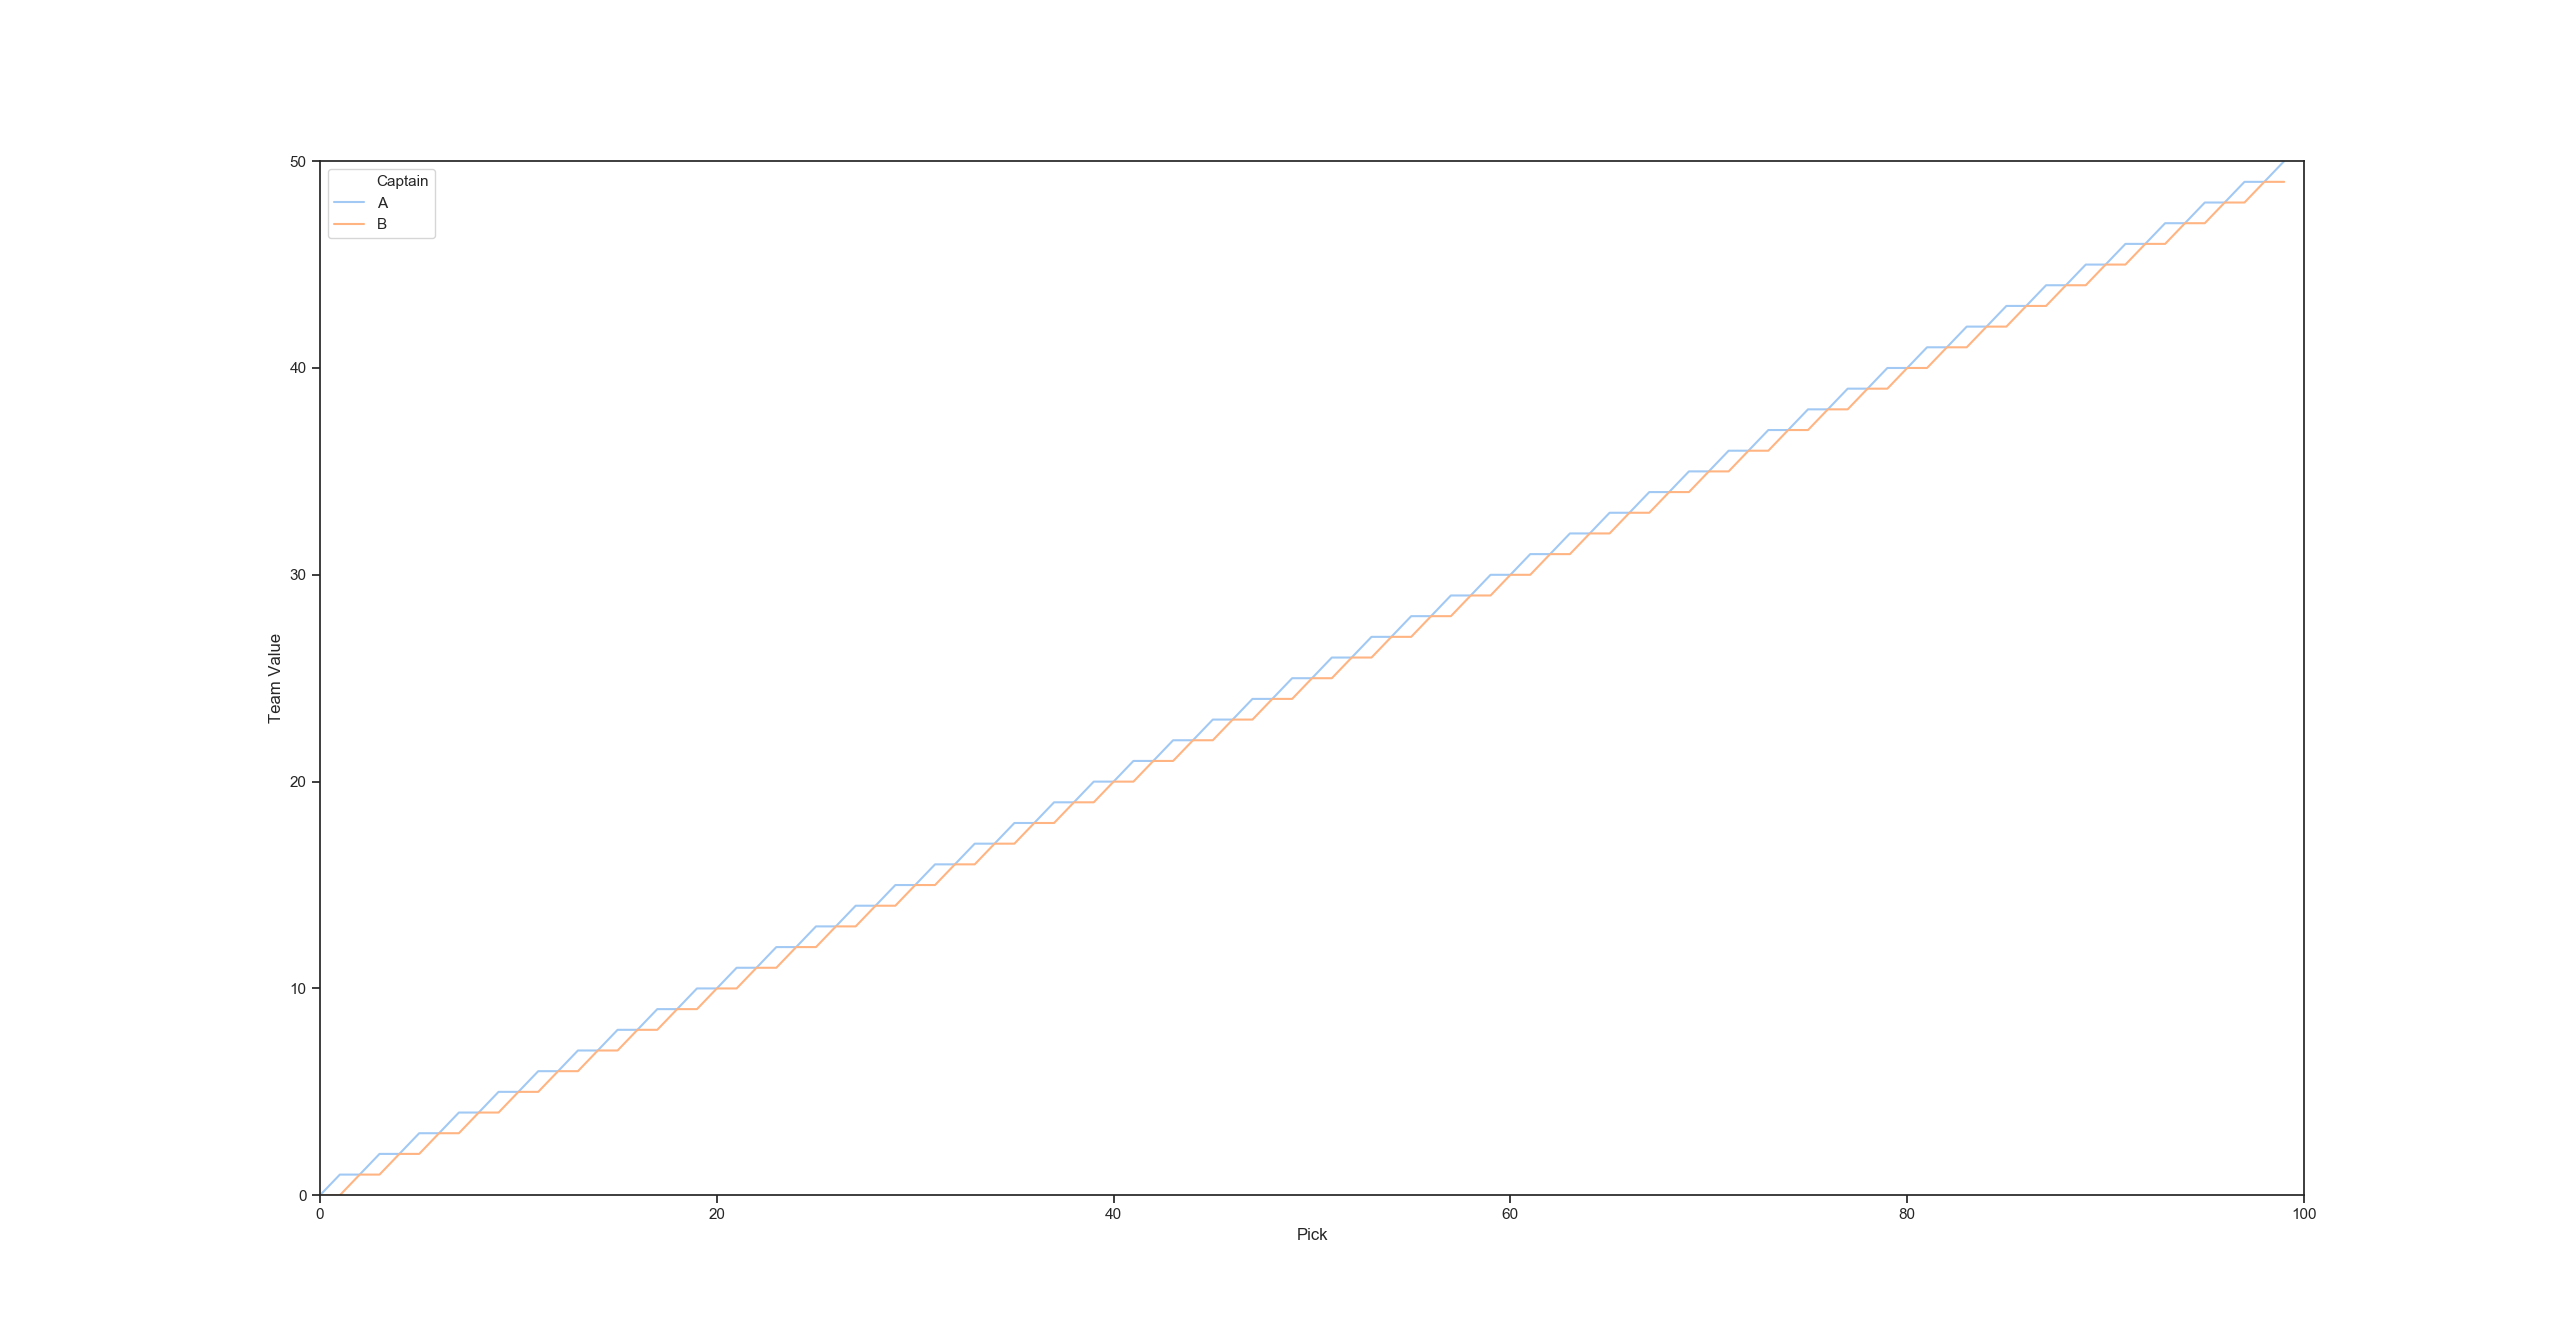
With Pattern A, each captain is advantaged for equal amounts of time:
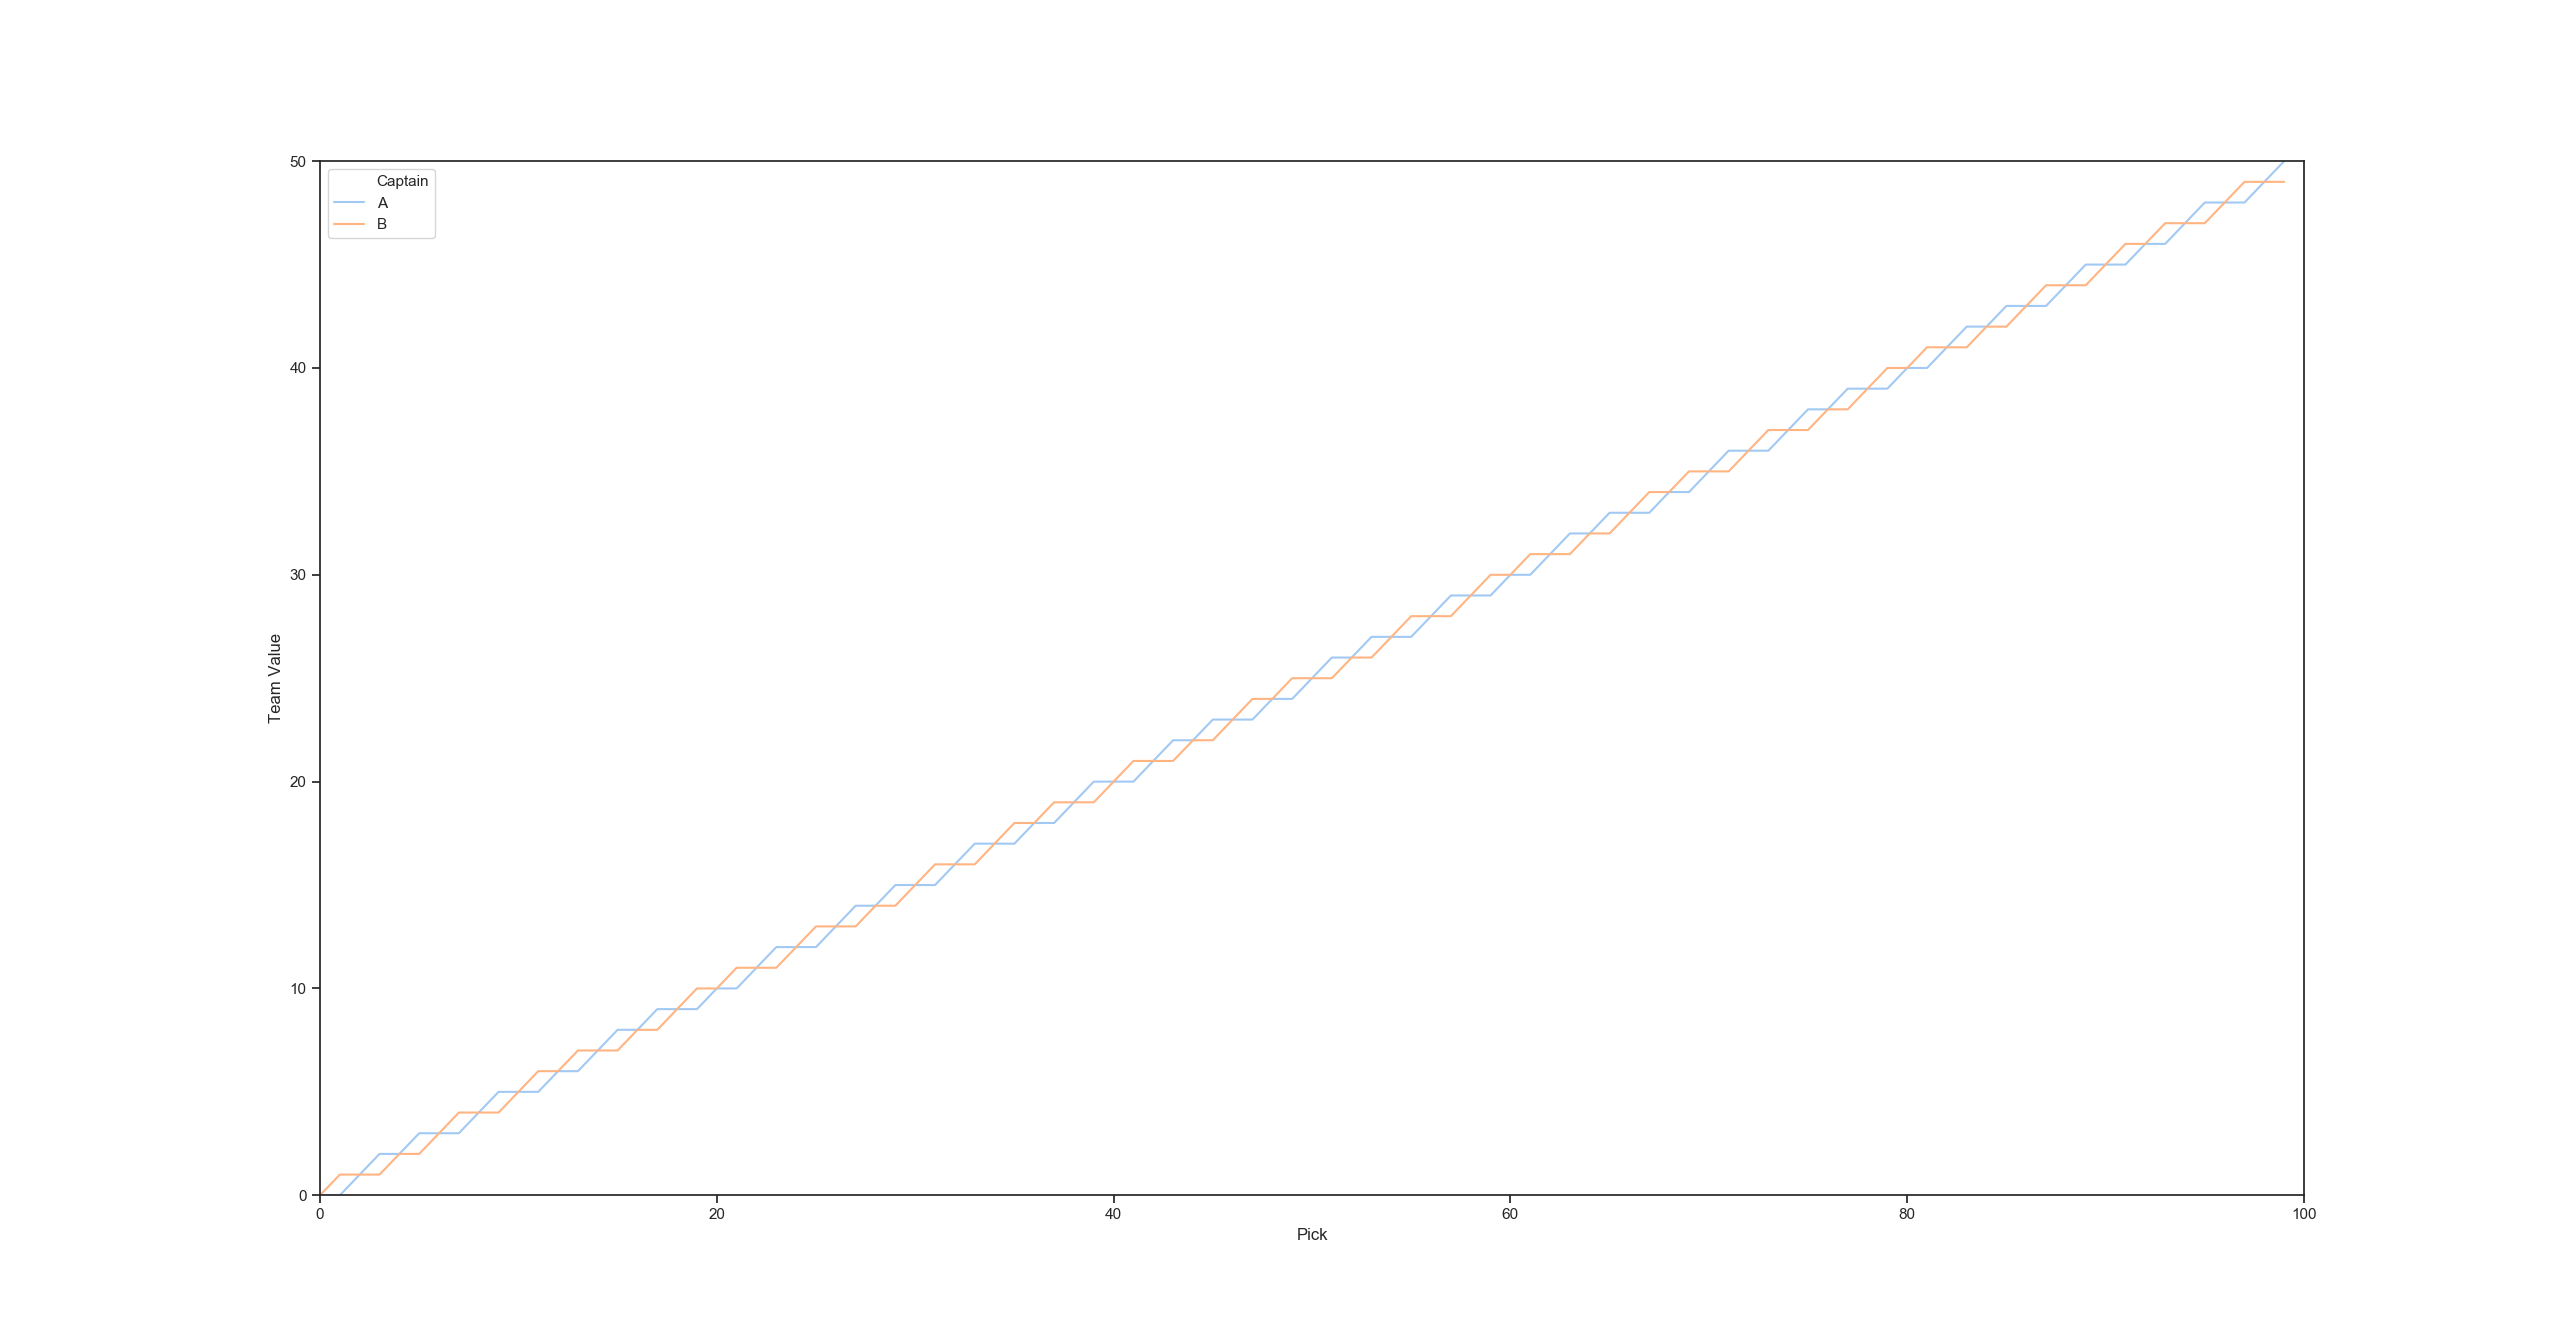
Said in another way...
If you average expected team value, Pattern B never converges, with Captain A advantaged:
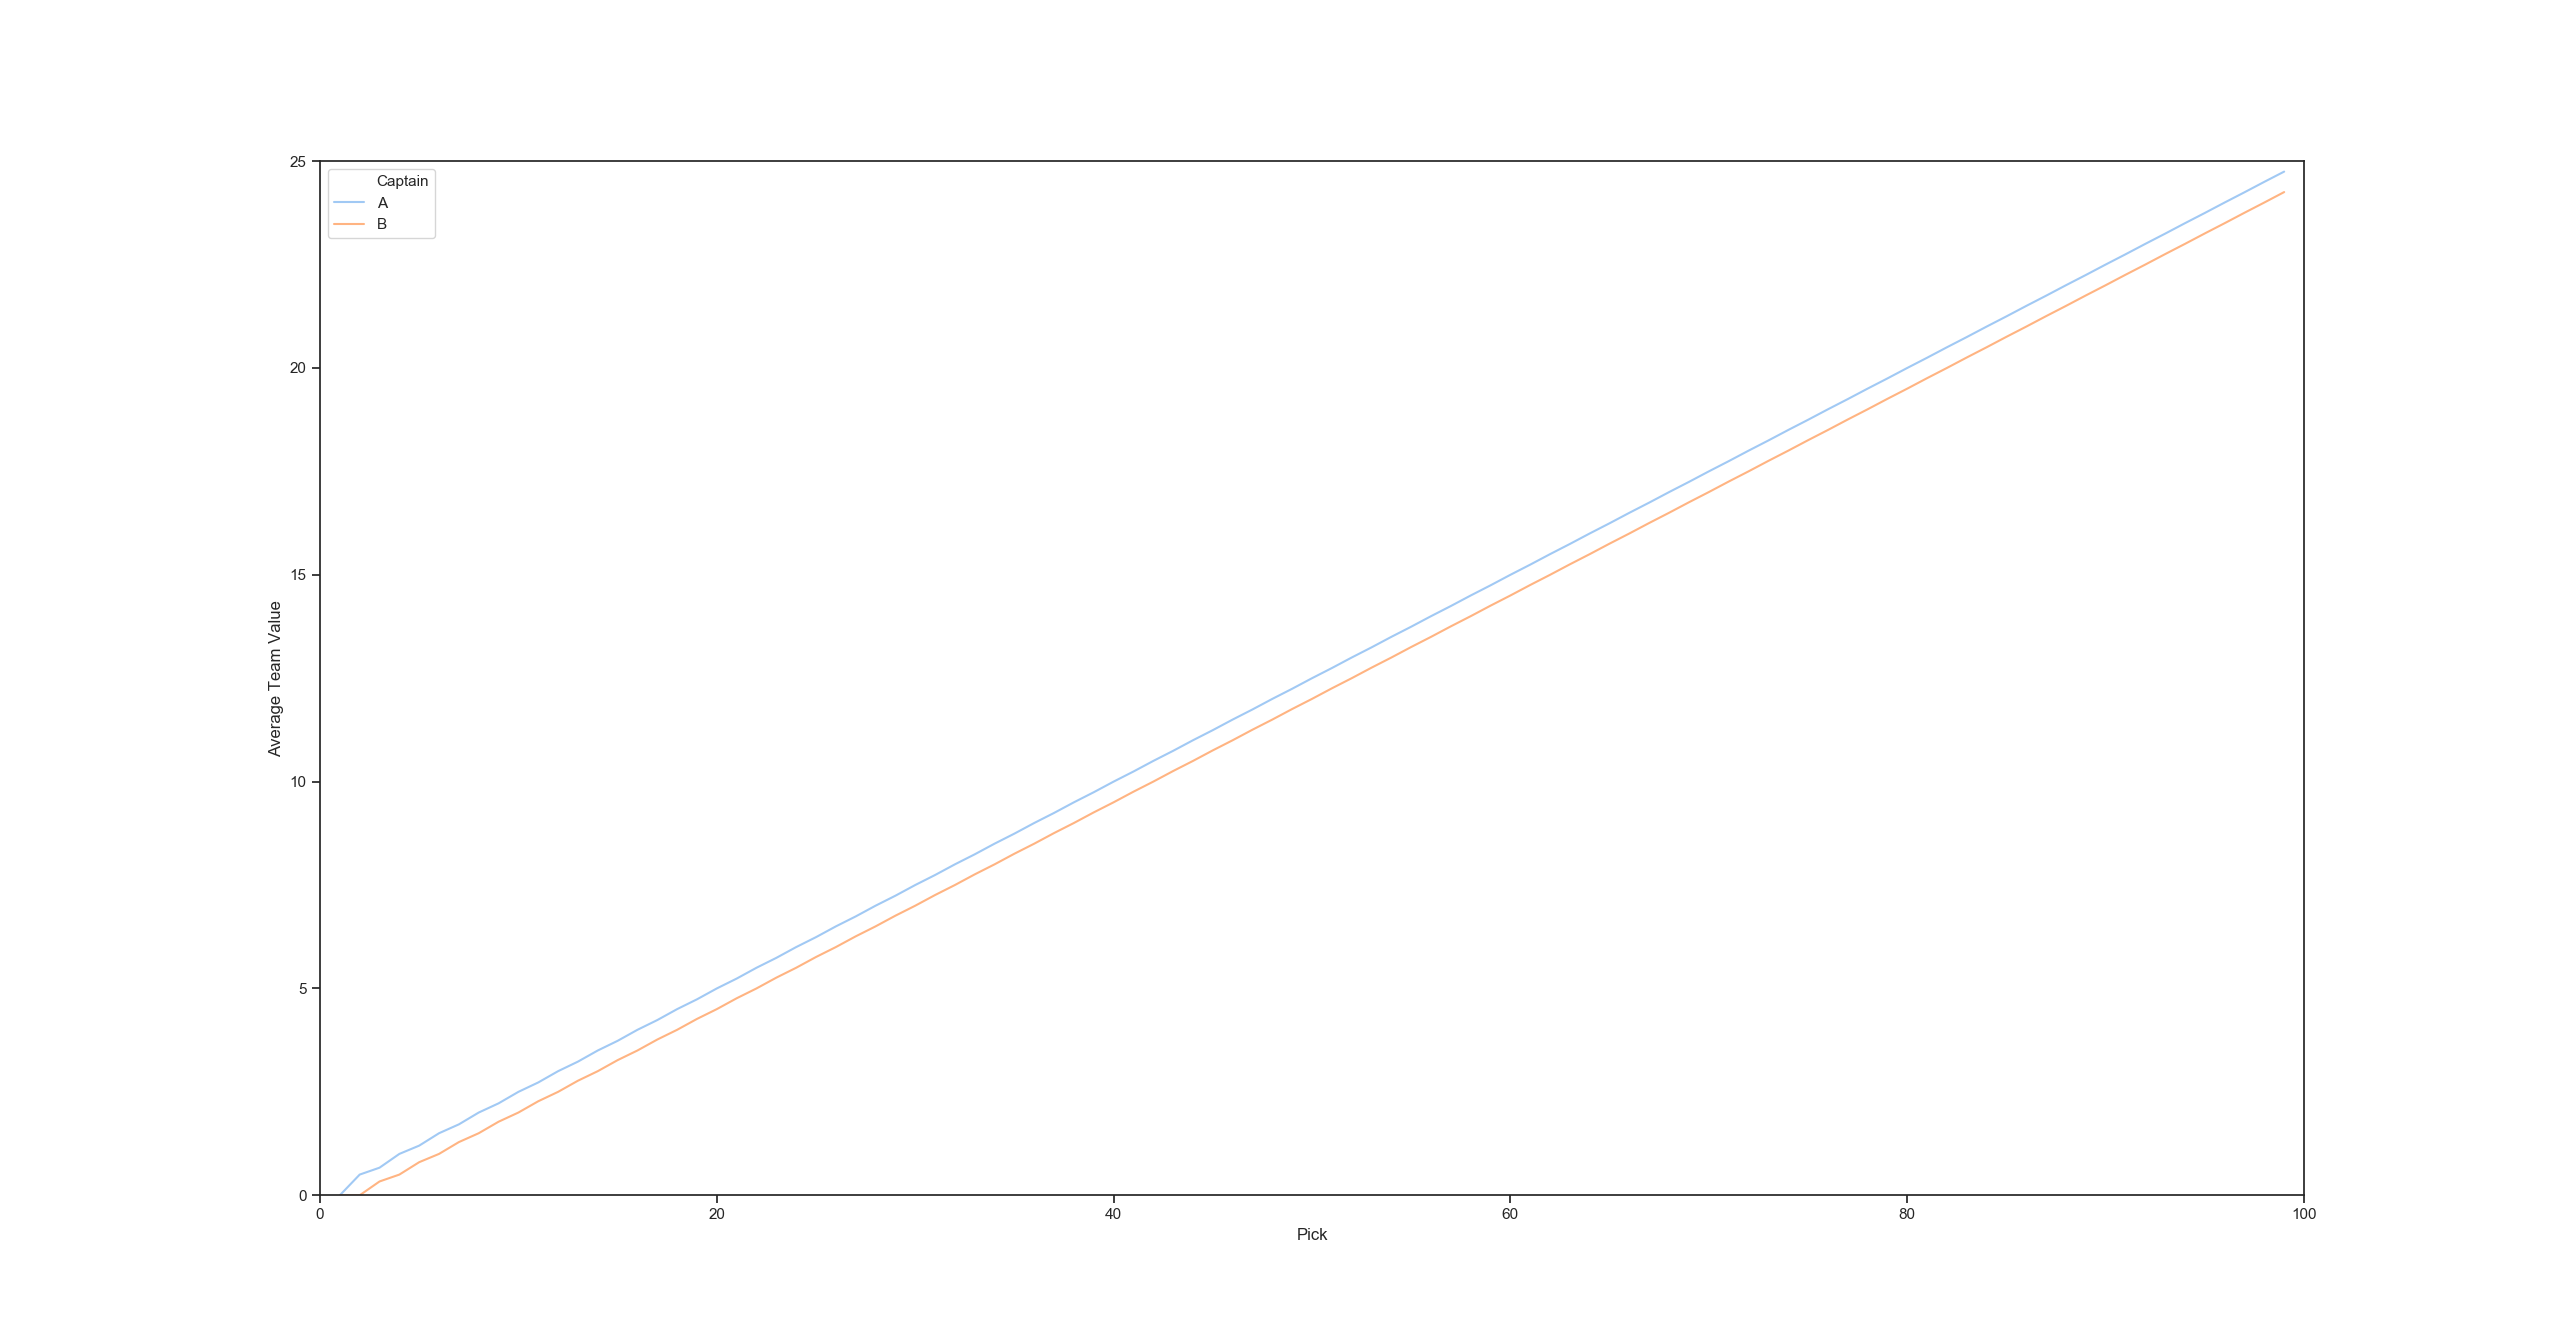
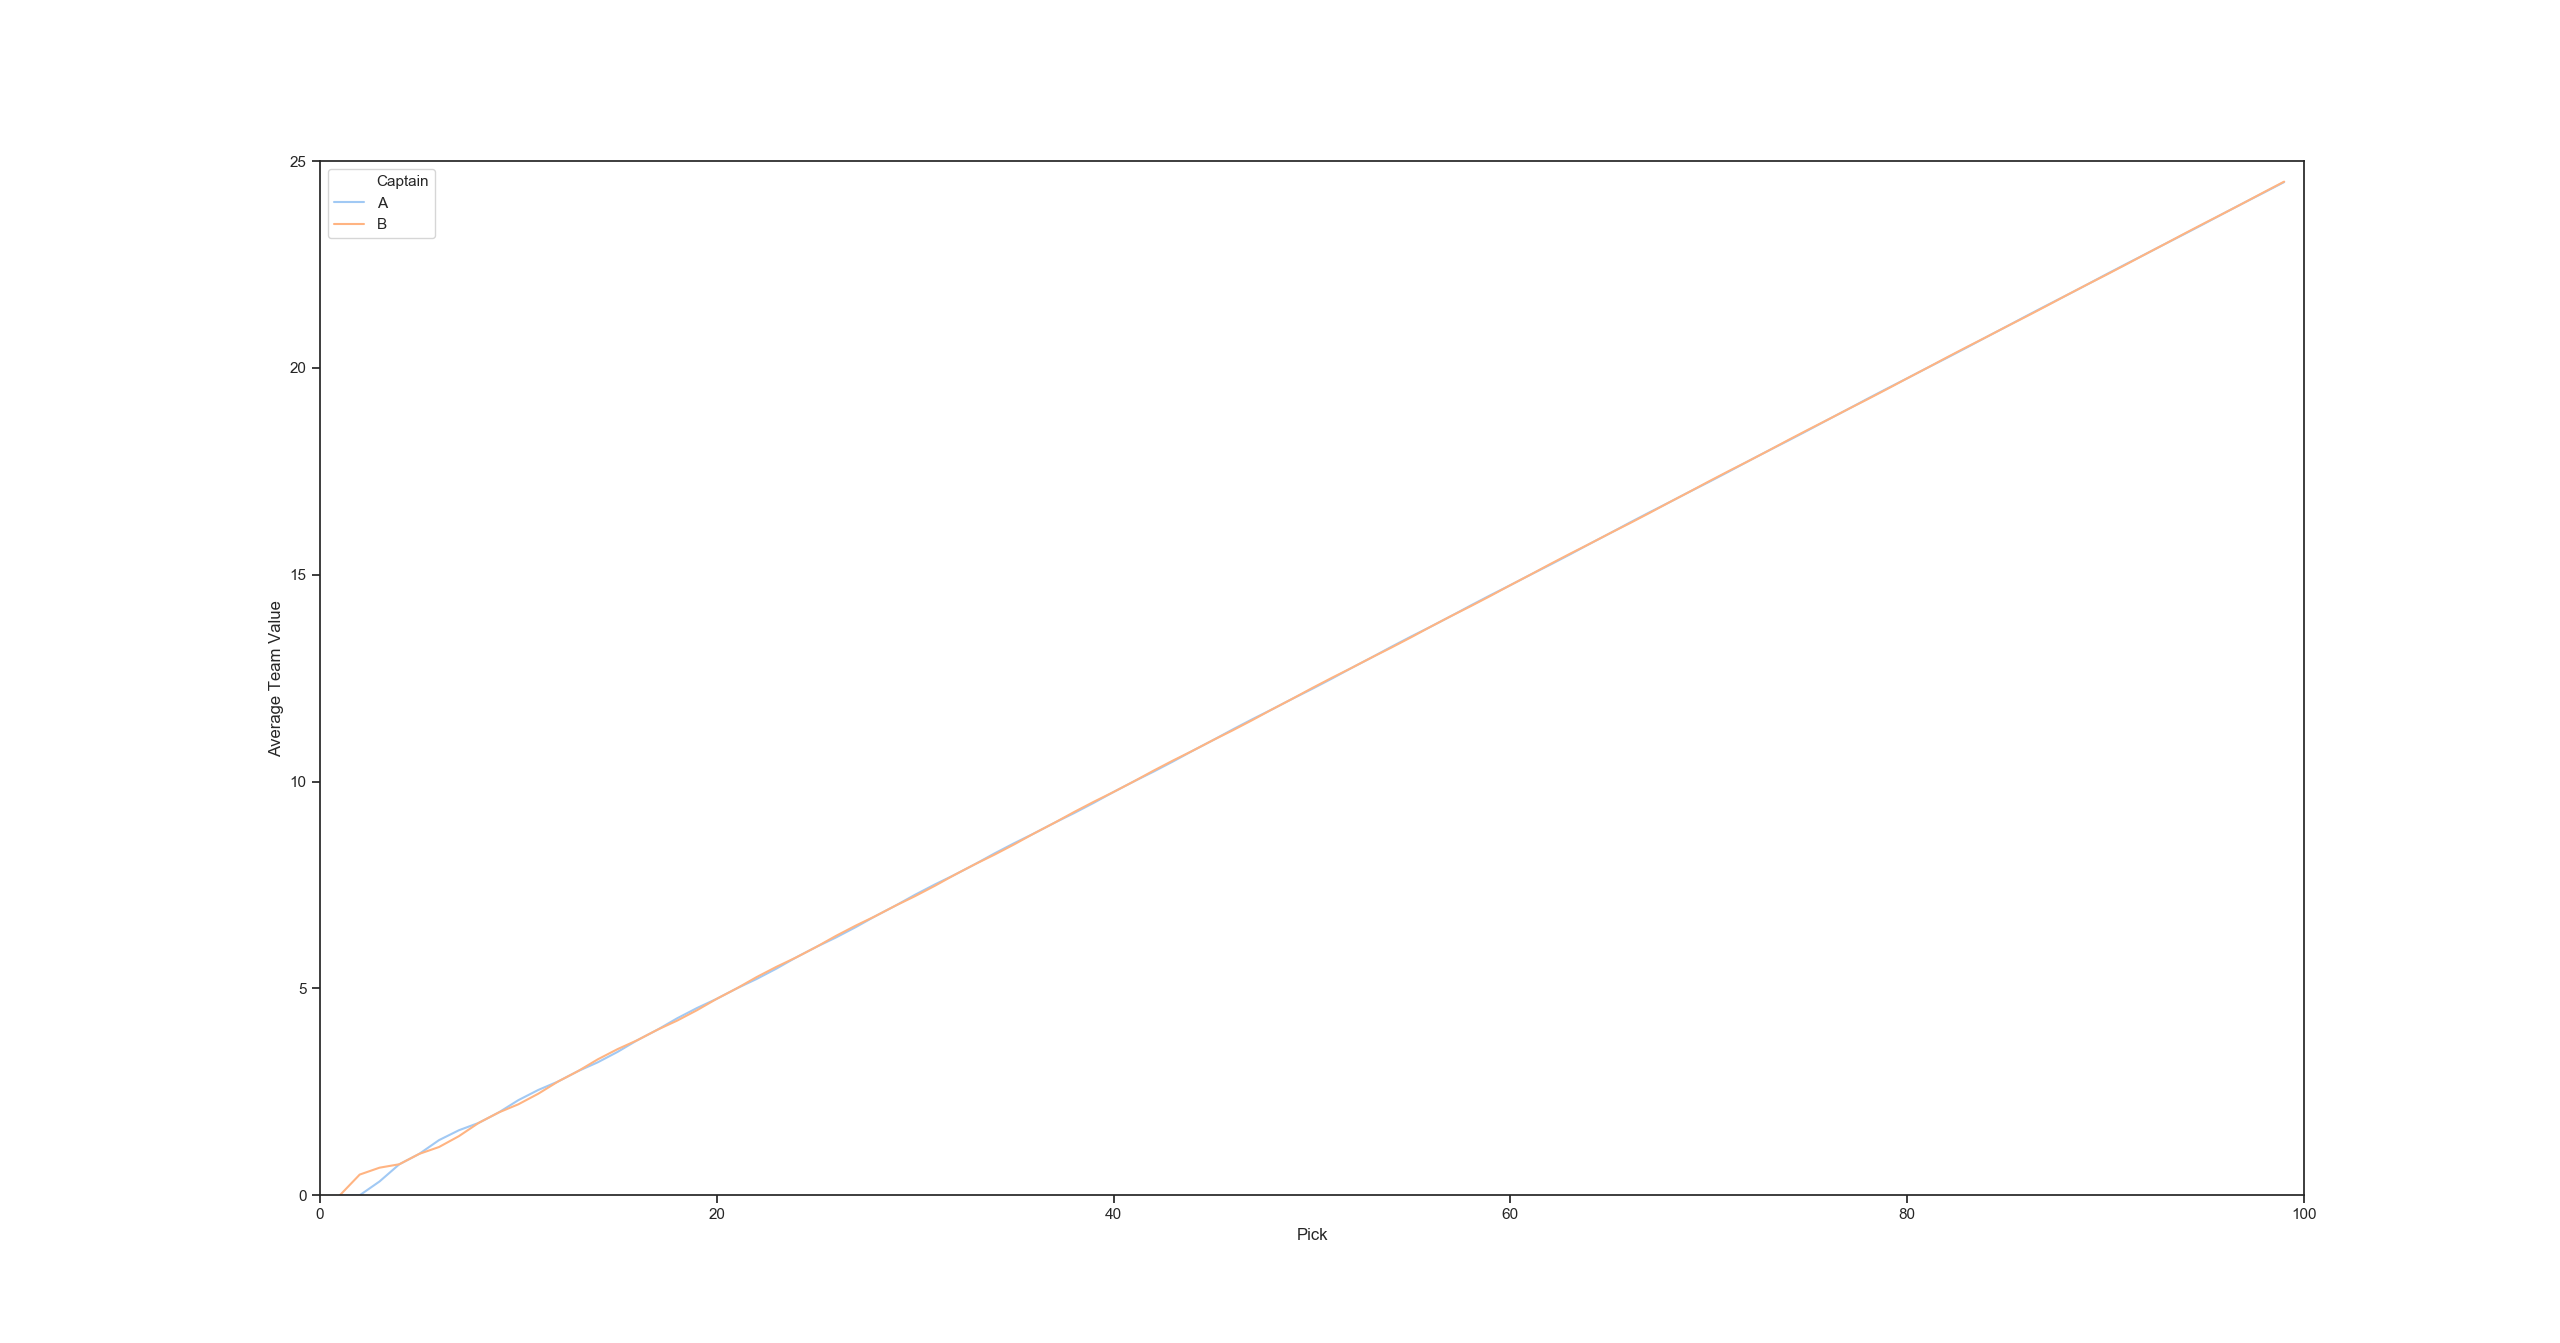
However, with Pattern A, the team values converage quickly and each team has equal expected value after a few picks:
